Update 3/7/2020: I now believe that, contrary to what this post suggests below, that at least the amended chart is based on ‘true average’ figures.
—————————————
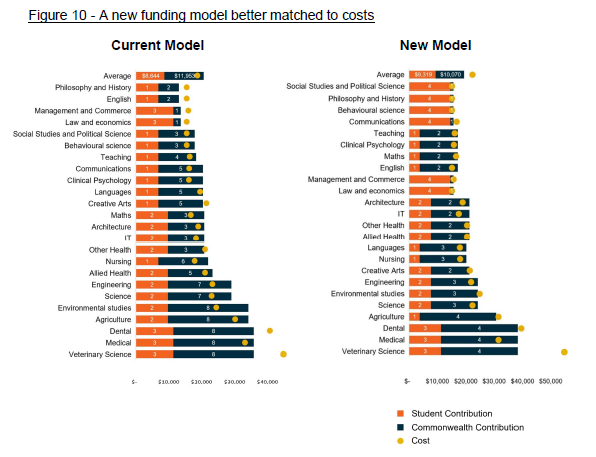
On Twitter the new funding rates in the Tehan higher education reform package are being criticised for not covering costs in most fields. That’s a completely understandable concern, given that the government’s own discussion paper suggests that this will the case, by publishing the chart below.
Fortunately for universities, if this package makes it through the Senate, I think there is a mistake in the chart’s figures. I noticed this because I initially made the same mistake myself when analysing the underlying cost figures for this blog post last month. (Update 24/6: The latest version of the discussion paper has a lower overall average cost than the chart above.)
The discussion paper talks about the ‘average’ cost. But the cost spreadsheet the Department gave me does not, as I said last month, include a true sector average at the field of education level (total expenditure for field/total EFTSL in field). Rather, it is an average-of-averages (average expenditure by field at each uni added up/number of unis teaching that field).
Deloitte’s analysis of the cost data shows, unsurprisingly, that higher education has economies of scale, so an average-of-averages cost number would be distorted upwards by low EFSTL/high cost institutions.
I concluded that the costs reported by the median institution would be a more representative cost, since it’s likely that most students are in the institutions that have achieved economies of scale. That conclusion was corroborated by multiplying both the average-of-average and median-of-institutions figures by the relevant EFTSL. The median method arrived at a total that was much closer to the overall Deloitte aggregate cost estimate.
To compare the proposed 2021 funding rates and average-of-average costs I inflated the 2018 figures by 6 per cent and compared to them to the proposed new student funding rates. Fifteen of the 23 disciplines I have numbers for are loss making on these average-of-average numbers, although some by a small amount.

But if I switch to median costs the situation improves significantly, with five disciplines coming out as loss-making, one by less than $100.
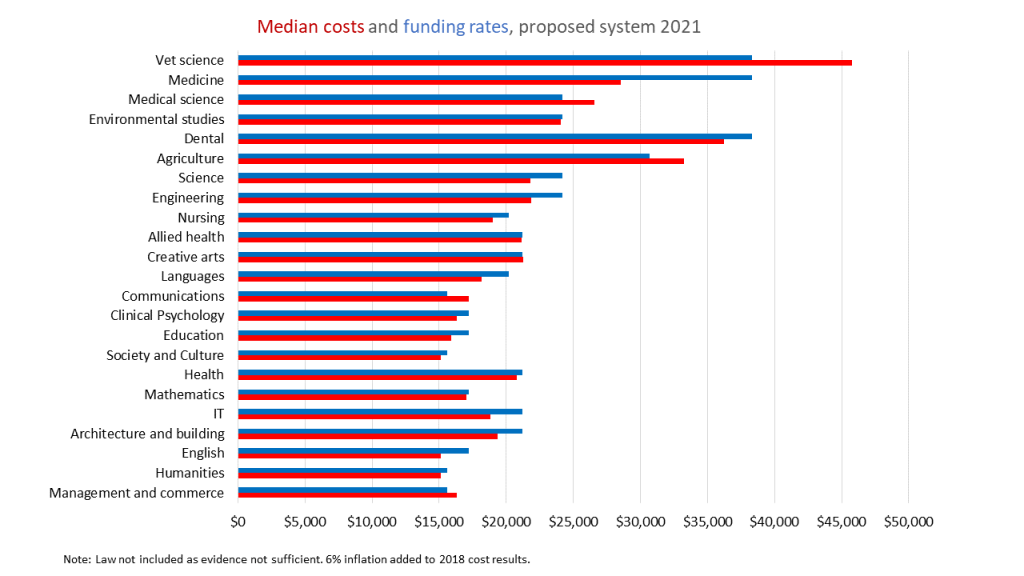
One of the many (too many) things the government is trying to do in this package is better align costs and funding rates, and using median costs they largely achieve that with their new rates. The profits and losses are both typically smaller than under the current system.
While I think there are problems in cutting the profit margins out of the current funding rates, which I will discuss elsewhere, they are probably not as serious as figure 10 in the discussion paper suggests.

Hi Andrew – I note from the department FAQs that new fees apply for ongoing students when the new fee rates are lower. –
Q. ‘I am a continuing student studying engineering – do I get to pay the new lower student contribution?
A. Students enrolled in units that will be subject to a lower student contribution amount under the new design will pay the new lower student contribution, regardless of when they commenced their course.
This may have a significant implication for universities – they would appear to pick up the downside impact of the lower fee rates (and consequent overall revenue reductions on existing students– assuming that the new cluster rates accompany the new fee rates), but do not collect higher total revenues for Arts & Business from existing students, only commencing ones. I don’t have the data to calculate the impact of this, but perhaps you do?
cheers
Andy
LikeLike
Andy – I am not 100% sure what is going to happen. I infer from point 2(a) in this document that it is more likely that unis will be compensated, but it is not entirely clear: https://www.dese.gov.au/document/technical-note-job-ready-graduates-package
LikeLike
I think 2a only refers to grandfathered students, the non grandfathered ones don’t seem to get a mention, but maybe this will be cleared up in the final legislation / regulations….
LikeLike
Hi Andrew. I found these charts interesting so looked up the source. It does not appear to be even internally consistent. The paper states that:
“An analysis of current total combined government and student funding compared to costs of delivery shows some fields are over-funded, while others are underfunded.
Social studies, science, behavioural science, creative arts, nursing and education for example, are currently over-funded on average. While law, commerce, accounting, management and agriculture are all under-funded on average.”
Yet their own chart (Fig 10) shows Creative Arts to be underfunded (cost greater than combined student and Commonwealth contribution) and Agriculture to be overfunded (contributions greater than cost).
Regards
Cara
LikeLike