This is a post I started writing several months ago, before the Accord final report and other major higher education policy announcements pushed it aside. I have completed it as a companion to my census attainment post on data issues in higher education.
Late last year several media outlets, using data from the ABS Education and Work survey, reported declining bachelor degree enrolments. In November 2023, bachelor degree enrolments were said to be down 12 per cent between 2016 and 2022. Another newspaper rounded the drop to 13 per cent. In December 2023 bachelor degree enrolments were said to be at their lowest level since 2011.
This post explains why these media stories exaggerate enrolment decline. The most important reason is that Education and Work does not count offshore international students. But comparing Education and Work results with enrolment data shows that it typically undercounts onshore international students and overcounts domestic students, particularly those in bachelor degrees. It also has occasional rogue surveys that produce misleading comparison years.
Comparing sources on bachelor degree enrolments
The best comparison point for the Education and Work is Department of Education enrolment data. However the two data sources differ in ways that should affect their respective totals.
The enrolment data should be higher than Education and Work because:
- Education and Work only includes onshore students – it is a sample survey of people in Australia. Clearly fewer international students were in Australia during the COVID period, so Education and Work student numbers should fall by more than actual enrolments.
- Education and Work is a survey conducted in May each year, while the Department’s data includes enrolments reported by higher education providers over a calendar year. Education and Work does not count people starting courses after May until the following year.
- If a person enrols in two different higher education providers in the same year the Department counts them twice. Education and Work counts enrolled persons rather than adding up enrolments in institutions.
There is, however, one way in which Education and Work could correctly count more people than the Department. The published enrolment data only includes higher education providers eligible for HELP loans. Nearly 60 non-university higher education providers remain outside this system. While none are believed to be large, if their students are in the ABS Education and Work sample they would be counted.
Comparing enrolments
In line with the methodological differences, bachelor degree numbers are higher in the enrolment data than Education and Work in every year but one between 2010 and 2022. The exception is 2012. Education and Work spikes from 2011 and then drops back in 2013. It looks like a rogue survey sample. Domestic bachelor degree numbers surged in the early 2010s due to the demand driven system. International enrolments were down but not by enough to cause an overall fall in enrolments.
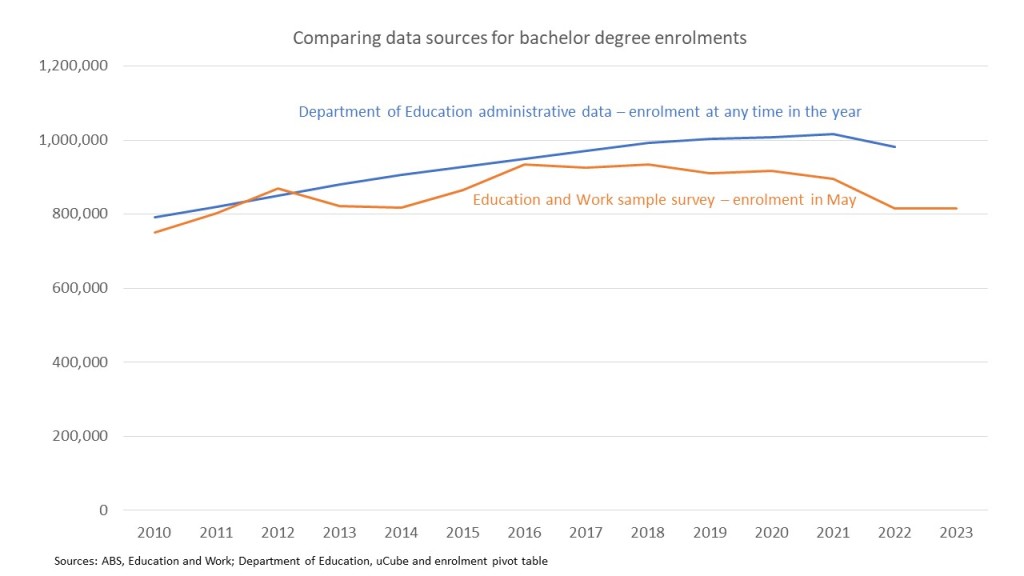
Since the mid-2010s the two data sources have diverged, not just in their totals but in some years also the direction of change. In 2019 and 2021 Education and Work recorded enrolment decreases while the Department of Education reported increases. In 2022 both sources reported falling student numbers, but by twice as much in Education and Work.
The cumulative result is that between 2016 and 2022 Education and Work reports a 12.7% decrease in bachelor degree numbers while the Department of Education reports a 3.3% increase. What is going on?
Offshore international students
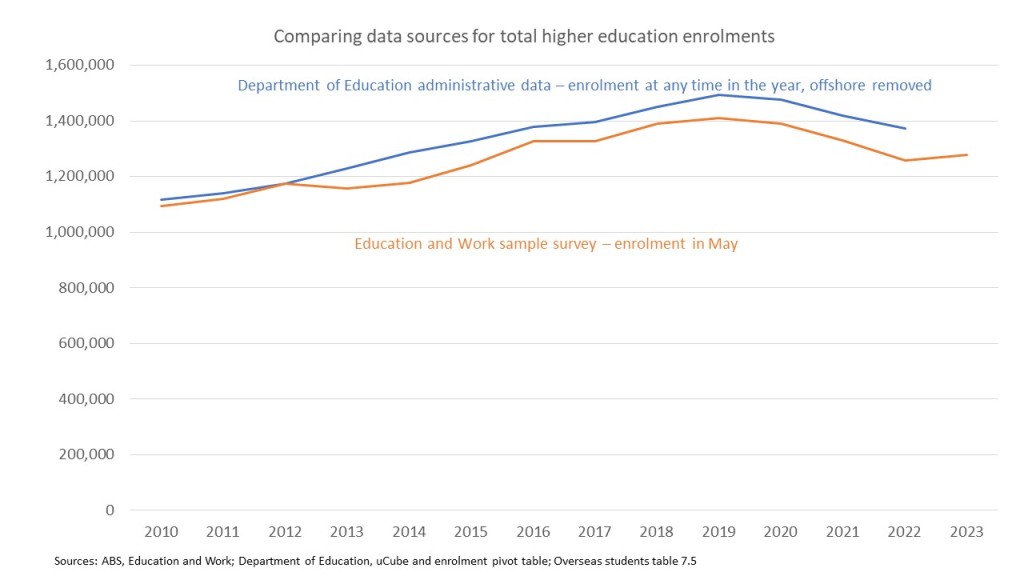
Offshore students are a key reason for the different results. Offshore international student enrolments spiked in the COVID period, putting a larger share of total enrolments out of scope for an Australian sample survey. The Department of Education does not publish offshore enrolments by qualification level, so I have switched the comparison to all enrolments.
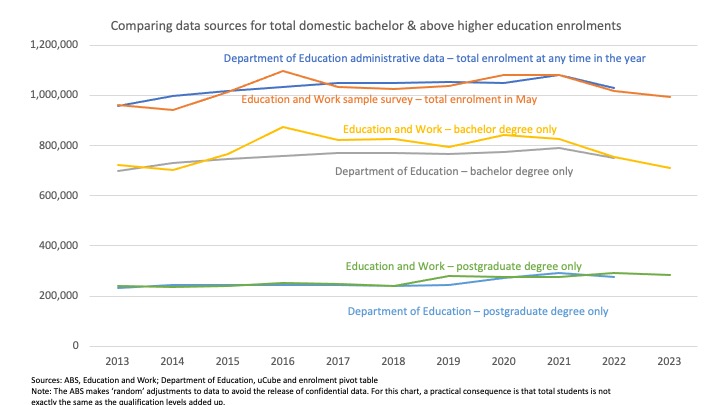
As the chart below shows, with offshore enrolments removed the two data sources now align more closely in both total numbers and their overall direction. In the 2016 to 2022 period Department of Education total enrolments are down -0.3% and Education and Work by -5.3%.
International students are undercounted by the ABS
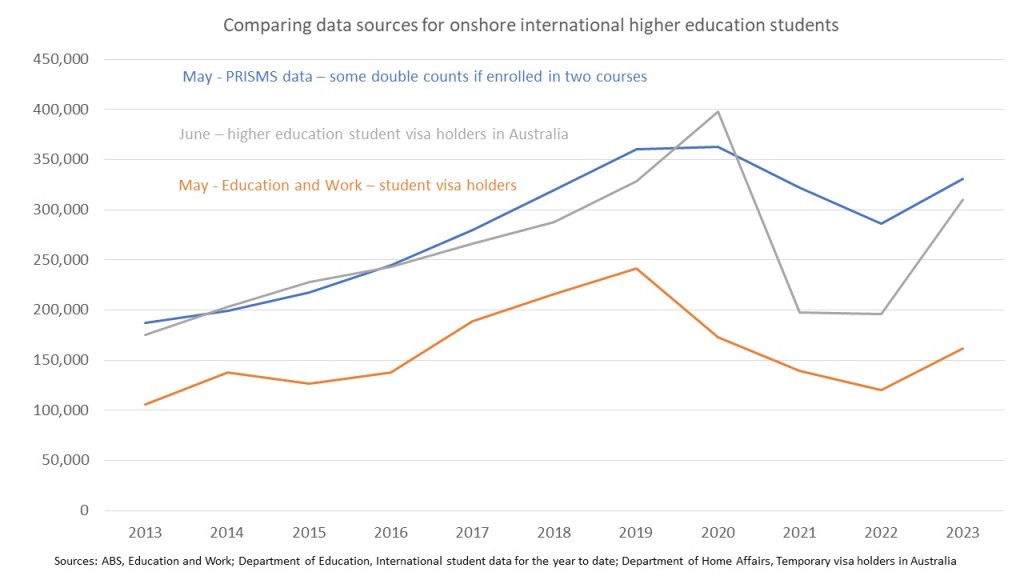
Offshore international students do not, however, fully explain Education and Work’s lower enrolment numbers. It also reports significantly fewer onshore students than sources based on administrative data, as seen in the chart below. PRISMS counts enrolled student visa holders, although they may not be in the country on a given date. The June numbers in the chart are student temporary visa holders actually in Australia (reported quarterly rather than monthly). The Education and Work international student numbers are never more than 75% of the other data sources for onshore international students in May or June, and often much less – especially in recent years.
A couple of years ago I contacted the ABS about these discrepancies. One reason is differences in scope. The ABS only includes people who satisfy the 12/16 rule for net overseas migration, that once obscure number that is now central to the politics of international education. Only people who have been or plan to be in Australia for at least 12 months out of a 16 month period are counted. Given the length of higher education qualifications this should not affect this post’s analysis too much, but would undercount ELICOS and vocational education students more significantly.
The ABS also acknowledged that international students tend to be under-represented in their sample because their accommodation arrangements and high mobility rates make them hard to find.
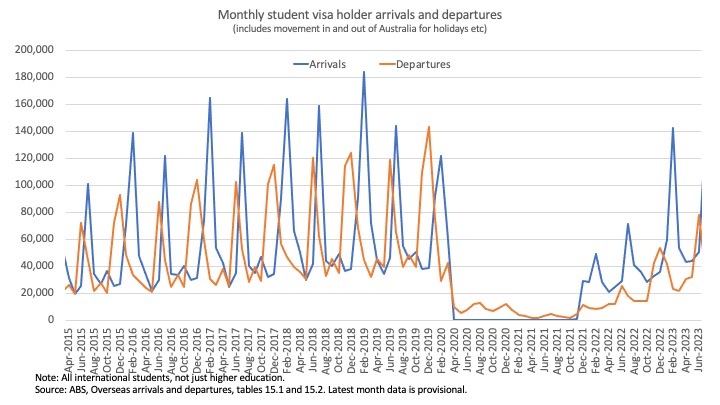
International students often spend time outside Australia. On March 1 this year, when being stranded overseas was no longer a problem, 4% of enrolled international students were not in the country. The chart below shows student visa holder arrivals and departures, with arrivals peaking each non-COVID year in January and February and departures in November and December. These numbers include long-term arrival and departures, but also students going home for summer breaks.
The way the ABS sample works would also have delayed including returning international students in 2022. Education and Work is a supplement to the monthly ABS labour force survey. This survey does not use a new sample each month. Selected households remain in the survey for eight months. The ABS rotates out and replaces one-eighth of the sample each month. At the time of the May 2022 Education and Work survey, nearly 40% of the labour force sample had joined it before the borders re-opened in December 2021.
But domestic students are often overcounted by Education and Work
Narrowing the analysis to domestic students reveals other issues with Education and Work. As for international students, the Department of Education enrolment data should always have higher totals than Education and Work – due to a whole-of-year rather than single month count, double counting of some individuals, and perhaps a small number of offshore domestic students who would not appear in an ABS survey.
For Education and Work I used Australian and New Zealand citizens as a proxy for domestic students, as it does not separately identify permanent residents, who are counted as domestic students in the Department’s enrolment data.* In 2022 the Department’s numbers include nearly 44,000 permanent resident and permanent humanitarian visa holders who are not in the Education and Work total.
Despite multiple reasons why the enrolment data numbers should exceed those in Education and Work, that is only true in some years, as the chart below shows. Especially for bachelor degrees, Education and Work gets higher numbers in most years. The apparent overcount has become less significant in the more recent surveys. But in 2016 – the comparator year in the media reports mentioned earlier – Education and Work reports 15% more domestic bachelor degree students than the Department of Education.
Conclusion
Media reports of a major decline in bachelor degree enrolments were significantly exaggerated. The most important reason is that their source, the ABS Education and Work survey, does not include offshore students. As COVID forced more international students to remain in their home countries enrolments as measured by an Australian sample survey inevitably fell. Undercounting of onshore international students is also a factor, especially for 2022 when the ABS survey methodology meant fewer than usual were in the sample.
More detailed examination of Education and Work’s results show that domestic students are often overcounted compared to enrolment data. In the aggregate figures, this to varying extents across the years offsets the undercount of international students.
Education and Work, like any sample survey, is vulnerable to sampling error. In general it seems to have too many domestic bachelor degree students in its sample, but more so in 2016 than usually. The apparent fall from that enrolment peak reflected a more accurate sample rather than a real decline, which did not happen until 2022.
So while bachelor degree numbers in 2022 were the lowest since 2017 they remained higher, not lower as suggested by Education and Work, than in 2016.
*Previously permanent residents were identified in Education and Work, but they are now in an aggregate category of ‘other visa’ (other than a student visa). In the years when this category had PR as a sub-category a significant minority of people classified this way were not permanent residents. As the ‘other visa’ category continues to be significantly higher than the combined total of permanent residents and permanent humanitarian visa holders in the enrolment data I have not included them in the Education and Work domestic totals.
