In an earlier blog post, I calculated that universities made about $1.3 billion in 2018 from teaching domestic students. This post looks at profits and losses by field of education. Due to data limitations, the analysis is restricted to domestic bachelor degree students in Commonwealth supported places.
The first post included several methodological caveats. In drilling down further I must add more words of caution.
Costs are allocated according to the ABS fields of education. These do not necessarily correspond to the faculties and departments that organise and pay for teaching, and which have common cost structures from shared infrastructure and staffing.
For example, ideally law, which often has its own faculty, would have been separate from other ‘society and culture’ fields like humanities and social science. Economics is usually taught in commerce faculties, and so its costs would be closer to those of business courses than the ‘society and culture’ category in which it is placed. (If the ABS has ever had a worse idea than ‘society and culture’ I am yet to see it.)
In the earlier post, I used a Deloitte Access Economics calculation of the average cost by qualification level. The field of education data cost data I have (in chart form here) does not include a true sector average (total expenditure/total EFTSL). Rather, it is an average of averages (average expenditure by each uni added up/number of unis). Deloitte’s analysis shows, unsurprisingly, that higher education has economies of scale, so an average of averages cost number could be distorted by low EFSTL/high cost institutions.
Because of this, I used the cost reported by the median institution to limit the influence of low-enrolment, high-cost outliers. Median costs were then deducted from the funding rates by field in 2018 to calculate a profit or loss. The relevant profit or less was then multiplied by the relevant bachelor degree narrow field of education number of EFTSL (this includes private university and non-university provider students, so the totals for public universities alone will differ from those reported in this post).
As a test I added up profits and losses by field across the sector using both median and average costs. With the median getting much closer to the aggregate surplus reported in the first post for bachelor degrees it looks like the better figure to use.
With all these caveats, the slide below shows that in most fields of education a university with median costs will generate a surplus on 2018 Commonwealth supported student funding rates. But the level of surplus varies significantly, and there are some loss-making fields.
Science/engineering fields generate large surpluses per student. The funding rates owe much to the relative funding model from the early 1990s, and I suspect that high research expenditure in those fields at that time remains embedded in the funding rates.
At the other end of the profit/loss spectrum, in several fields universities lose money at the median cost rate. Three of the four – veterinary science, dentistry and creative arts – at least partly need small group or one-on-one teaching, as well as specialised infrastructure. These fields are less amenable to the economies of scale that have controlled costs in other disciplines. Medicine (‘medical studies’) is reported as profitable, although the Deloitte report notes significant ‘in kind’ costs not paid by the university, with clinical training partly funded by the health system. 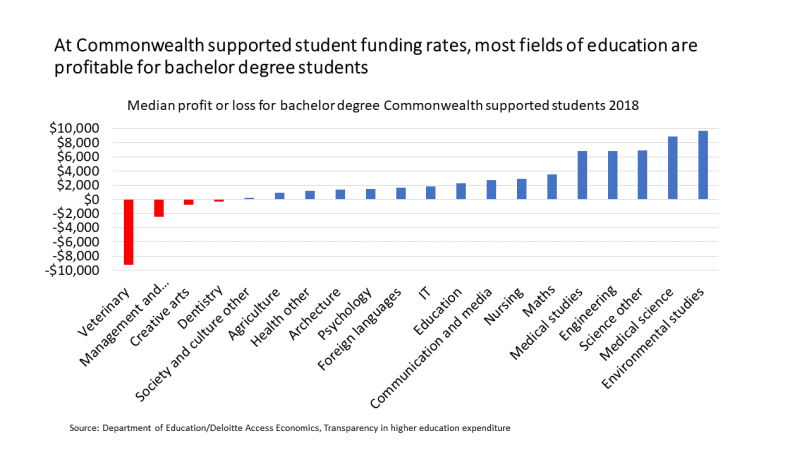
The fourth loss-making field, management and commerce, does not fit pedagogically with the others. My hypothesis here is that large numbers of international students – 46 per cent of student load in 2018 – are driving up costs, both due to inherent additional costs in the recruitment and regulation of international students, and in meeting their expectations with improved infrastructure and services.
To calculate overall profits and losses I have aggregated and organised the fields to better reflect the likely faculty organisation. Compared to the ABS fields of education, economics has been moved from society and culture to management and commerce, and communication and media has been moved from creative arts to society and culture. I left law out as I am not convinced that society and culture costs reliably reflect law costs.
On this analysis, science is very profitable, generating more than $500 million, which is close to half (47 per cent) of the net surplus in this model. It is not surprising that universities have expanded enrolments in science courses.
‘Arts’ generates a reasonable profit, but this is mainly because I attributed the large-enrolment and high-profit fields of communications and media ($68.5 million) and psychology ($37.8 million) to them. If it is social psychology this is a reasonable attribution, if it is clinical psychology it should be in health (or psychology could be in science as well). Generally, as the per student profit/loss slide shows, traditional arts fields (‘society and culture other’) are closer to break-even. Agriculture is also essentially break-even, its finances boosted by highly-profitable environmental science students, who may in reality be taught in science faculties.

The striking money loser, as expected given the per student figures, is management and commerce. While universities make super-profits selling international students these courses at $40,000 a year, they lose money selling them to domestic students for $13,000 a year. It is one of the several higher education funding models that look vulnerable in the COVID-19 era.

Maybe business schools’ glitzy buildings are being funded from recurrent income.
LikeLike
Very insightful post and absolutely spot on about Society and Culture. Though I have to say, dodgy statistical aggregations have their place – they keep people like me in steady work.
The standout for me is the field of environmental studies in the first chart. Based on this chart it looks like a river of gold for universities; yet it is a political trigger word for the current government, and they have already tried once to defund it (2014). Surely the days of agriculture and environment being subsidised at the same rate are numbered.
LikeLike
Fascinating analysis Andrew. What are the implications for the over-enrolling strategies that universities might adopt when faced with the twin dynamic of the Costello baby boom and capped CGS funding? You seem to have debunked conventional wisdom that the low CSP contribution to management and commerce would make it a target for over-enrolling strategies. What does the profitability chart look like if you look at the student contribution amount only, and where might universities therefore seek to over-enrol instead?
LikeLike
Jon – One caveat to all this is that we are looking at average costs within institutions. We don’t know a lot about marginal costs. It might the case that is in economically viable to take some additional business students at the student contribution rate. But it is unlikely that this could deal with a large increase in demand. When that happens, marginal costs could be higher than average costs, as new infrastructure might have to be built.
LikeLike