In an earlier post, I argued that higher education has substantial inequality-generating features. This post is the first in a series looking at how well Australia’s higher education system does in this context, starting with access to higher education. Essentially, this is about how well the higher education system can foster social mobility.
The potential of the Australia’s higher education system is constrained by the potential pool of students, which largely comes from people who have successfully completed school. Before the 1980s, that was a minority of the population. Don Anderson and A.E Vervoorn’s interesting book Access to privilege reports that in 1980 overall school retention to Year 12 was only 34.5 per cent, and 28.4 per cent at government schools. It was already a massive 88 per cent at the non-Catholic private schools, favoured by many higher SES families. They were setting up the basis for the next generation’s educational success.
In the 1980s, school completion rates increased, so that about half of low SES students finished school by the end of the decade. Low SES Year 12 completion is now at 73 per cent, compared to 80 per cent for high SES students (with the caveat that dividing the population into three groups misses likely much larger difference in the lowest and highest deciles).
ATAR results by SES are rarely published, but some Victorian data I published in a book chapter a few years ago shows the highest SES quartile by postcode substantially over-represented in the 90+ group, and the lowest SES quartile substantially over-represented in the below 50 group.
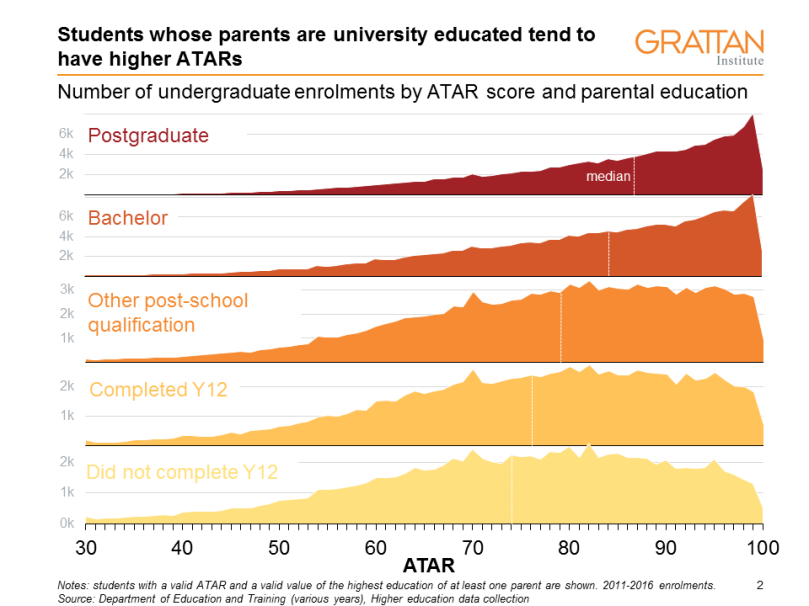
University enrolment data by definition doesn’t include Year 12 students who never apply, but we know that almost all high-ATAR school leavers put in an application. Using a parental education measure of low SES, we can see in the chart below that there are many more students with an ATAR reporting parents with a higher education qualification than we would predict based on the education levels of people old enough to be parents of undergraduates (notice the different scales).
Further, when one or both parents have degrees (the chart shows the parent with the highest qualification, but frequently both parents have degrees) the ATARs skew more markedly to the higher end, producing higher medians.
The annual NAPLAN reports show that, again, the high SES students, whether measured by parental occupation or parental education, do significantly better across all the literacy and numeracy tests, although consistent with meritocratic hopes there are – as the enrolment data also suggests – high achievers from disadvantaged backgrounds. So even though Year 12 completion has improved, we still have substantial issues with inequality of school-level academic achievement.
I don’t feel competent to judge to what extent university education faculties are to blame for this situation – although the early childhood research suggests that schools, also, are working within the constraints of the student pool. I will assess universities and higher education policy on how they deal with this academic achievement situation as they find it.
From the earliest days, universities and higher education policy (which was originally a State responsibility) have been concerned with access, offering students subsidies and scholarships. But that really only mattered in the post-WW2 era, since very few people before then went to university and it was not needed for most jobs. Hannah Forsyth has written about university admission policies in the post-war era. The Commonwealth government offered merit-based scholarships.
As higher education has become more important for life chances over the last 40 years, many Commonwealth government policies have been been designed to support access, including free higher education, heavily subsidised higher education, income contingent loans, income support, and a variety of programs aimed an encouraging or supporting low SES students. Every university offers relaxed entry requirements for students from disadvantaged backgrounds.
Under these policies, and within the constraint of academic results, there is little evidence that low SES school leavers are under-represented. The chart below is from the Longitudinal Survey of Australian Youth, showing university participation rates in 2012 of people who were in Year 9 in 2006 by socioeconomic status. They suggest that ATAR is by far the most important factor, with all SES groups following a predictable pattern of participation rising with ATAR. Buly Cardak and Chris Ryan have shown similar results from earlier LSAY surveys.

But due to the underlying inequalities in prior academic achievement, we still have very large differences in participation by SES. In 2014, the 20-24 year old children of managers and professionals were nearly three times as likely to be enrolled in university or to have already attained a degree than the children of drivers or labourers (HILDA data reported in Grattan’s Mapping Australian higher education).
However, there is also evidence here of upwards social mobility. In all the parental occupational categories for which degrees are not typically necessary, substantial minorities – from 20 per cent to 39 per cent – of their early twenties children are at university or already have a degree.

Although Australia has long had reasonably high participation in higher education compared to other OECD countries, we have usually had a system that capped total student numbers, leaving significant unmet demand – people who had applied for university, but did not receive any offers. Although applications were not tracked by SES until recently, rationing of places by prior academic achievement must have disproportionately disadvantaged low SES applicants.
The chart below suggests that easing the caps on student numbers from 2008 to 2011, and then abolishing them for bachelor degrees from 2012 to 2016, had a substantial impact using geographic measures of SES. Between 2005 and 2016, low SES commencing bachelor degree numbers increased by 80 per cent (the Index of Education and Occupation is the official measure, but numbers are generally higher if we use an index based on material disadvantage indicators instead). Other numbers released by the Department show that since 2014 overall low SES undergraduate growth has been driven by older students. Perhaps there is a pool of low SES background people who did not go to university after school but now want to.

There has been a long debate about whether student charges deter low SES students, and whether we should move to a free or cheaper system to encourage low SES students to enrol. As regular readers know, I think Australian policymakers have made broadly the right call on this issue. The biggest cause of low SES under-representation at university is academic achievement at school, and the second biggest issue has been supply constraints in the higher education system.
While I think the evidence for fees being a deterrent is not very strong – some temporary dips in demand after fee increases and some opinion surveys of school students, but these don’t seem to be reflected in enrolments – even if was stronger it would not support a move to free or cheaper higher education.
Requiring the taxpayer to fully fund higher education increases the risk that they will contain costs by capping numbers. Indeed, we (unfortunately) saw another example of this last December, when having failed to get some cuts to per student funding through the Senate the government instead capped total funding, effectively ending the demand driven system. That’s likely to stall the gains made by low SES students.
If the system may not be able to meet existing demand it does not make sense to use public money to encourage greater demand, instead of using it to increase supply and meet the demand we have already.
Overall, I think higher education policy probably deserves about 7/10 on access. Given what students have achieved by the end of school, the system accommodates aspirations at about the same level across the SES spectrum. But we could have achieved more and earlier without caps on student numbers, and it is likely we could have achieved more in the future if the caps had remained off.
Note: This post was updated with new material on 14/06/2018

Excellent analysis, Andrew, and I agree with you that a score of 7/10 probably is about right – though I’d probably land at around 6/10. Your analysis highlights a critical point of tension in public HE policy discussions. On the one hand, if universities are considered ‘passive’ infrastructure (i.e. mirroring, not altering, wider social norms), then they can do little to improve access and quality until the same has happened upstream, at the K-12 years. On the other hand, if they are considered one of the instruments of public policy, then they have failed to do all they can to offer alternative pathways to higher education, whilst improvements to the K-12 policy were being enacted. I think they have not done their best in the latter, hence my lower score than yours 🙂 As you note, once DDS came in, there was an upsurge in mature-age low-SES enrolments and I think this is evidence of my argument.
You know by now I am in agreement with you that broad, system-wide policy measures are more important than targeted interventions, when it comes to equity policy, so Australia’s approach of using an income-contingent loan was, I think, key to widening access and participation, for the reasons you outline.
Of course, another system-wide approach that was attempted was the abolition of tuition fees by Whitlam. The evidence, on balance, is that it didn’t deliver in the manner intended. Access was widened but not for the target group i.e low-SES students. It was mostly middle-SES, mature age, female students who benefited. However I think there is an argument to be made that the policy didn’t survive long enough for a robust analysis of its effect to be made.
Best of luck at the seminar next week, I’m sorry I will miss it.
LikeLike
Yes, ‘Access to privilege’ is most informative. It and a follow up paper in ‘Australian Universities Review’ reported that there was no evidence that Whitlam’s abolition of tuition fees increased participation by students from lower socio economic backgrounds.
It’s great that ANU has made ‘Access to privilege’ available to download.
Despite its entry in some library catalogues, I think ‘Access to privilege’ was co authored by A. E. Vervoorn.
LikeLike
Co-author added. I’ve never been able to construct a proper SES time series on free education, as the various studies all use different measures of SES. However, overall attainment was stable for that generation compared to the later Liberal years, so I think that it is unlikely the SES composition changed much. The expansion in places just kept pace with growth in demand from the baby boomers.
LikeLike
[…] an earlier post, I argued that the Australian higher education system probably deserved about a 7/10 for equity of […]
LikeLike
I think Anderson used school system as a proxy for socio economic status which he lamented was most unsatisfactory, but the best he could find.
Tim Pitman is compiling student equity statistics back to 1850. We all wish him good fortune and exceptional patience, and I look forward to his results.
LikeLike
[…] earlier posts in this series on inequality and higher education, I have suggested that the SES participation differences are largely driven by prior academic performance and that different SES groups seem to experience […]
LikeLike
[…] – there are a range of abilities in every part of the SES spectrum – it’s true that ATAR correlates with family background, student home location and school attended (the scale of school effects […]
LikeLike